Python / SQL / PowerBI

Iturncomplexdatasetsintodecisionspeoplecanacton.

I'm a data analyst with a computer science background, focused on turning messy, complex datasets into something actually useful, whether that's a geospatial model for academic researchers, a product metric that changed how a team built their app, or a dashboard that makes a trend visible before it becomes obvious.

Egemen Erin portraitavailable for data roles
3Years building with data
Stack Overflow tabs open

Analysis is not only about finding the number. It is about making the next move obvious.

01

Product behavior

Measure whether features change habit, retention, and participation.

02

Data pipelines & engineering

Build and maintain pipelines that move raw data from source to insight reliably.

03

Executive dashboards

Condense noisy survey and project data into concise, decision-ready reporting.

Selected work

Projects with a question, a dataset, and a decision behind them.

01
Emerging Trends in Software project screenshot — IBM analytics report / Cognos dashboard

IBM analytics report / Cognos dashboard

Emerging Trends in Software

A Stack Overflow Developer Survey analysis that turns technology adoption signals into hiring and learning priorities.

Question
Which programming languages, databases, and platforms are stable today, desired tomorrow, and worth investing in?
Outcome
Built a Cognos-backed report covering language demand, database shifts, cloud adoption, and developer demographics.
IBM CognosStack Overflow SurveyData wranglingDashboardsTrend analysis
Presentation project
02
Customer Churn & Revenue Analytics project screenshot — Data Analysis Project

Data Analysis Project

Customer Churn & Revenue Analytics

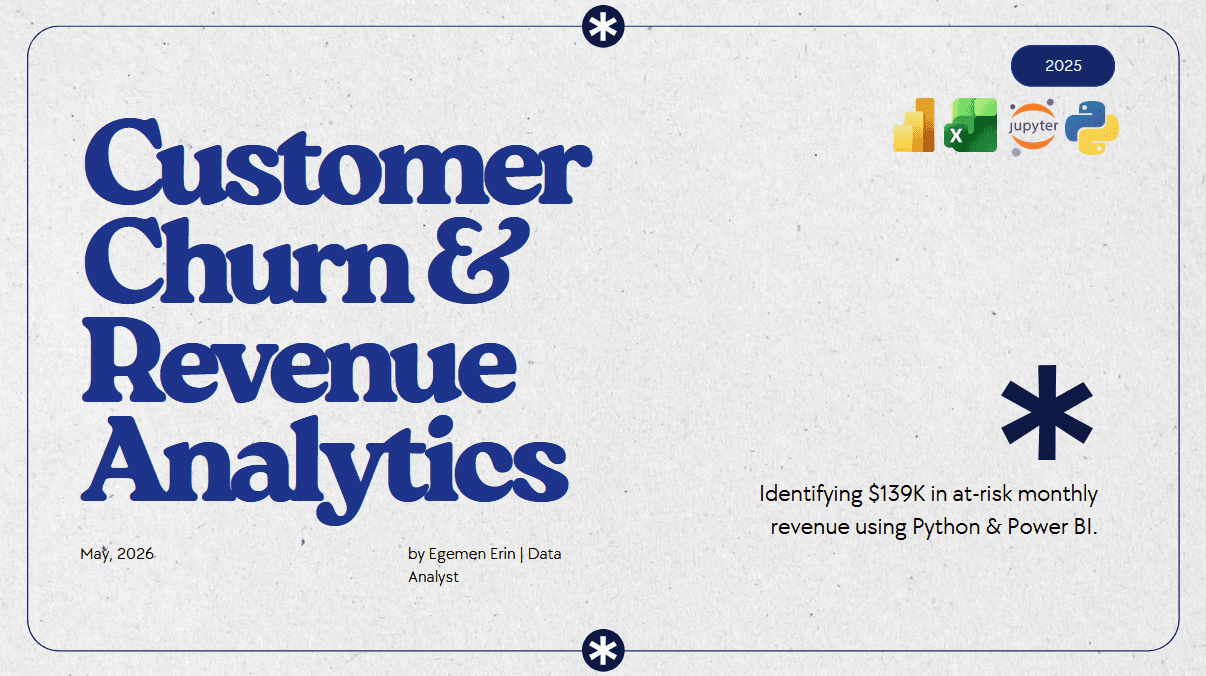
Built an automated reusable ETL pipeline in Pandas to clean and transform a 7,000+ row telecom dataset, handling hidden nulls, type casting, target binarization, and tenure cohort engineering. Built an interactive Power BI dashboard to analyze customer churn trends.
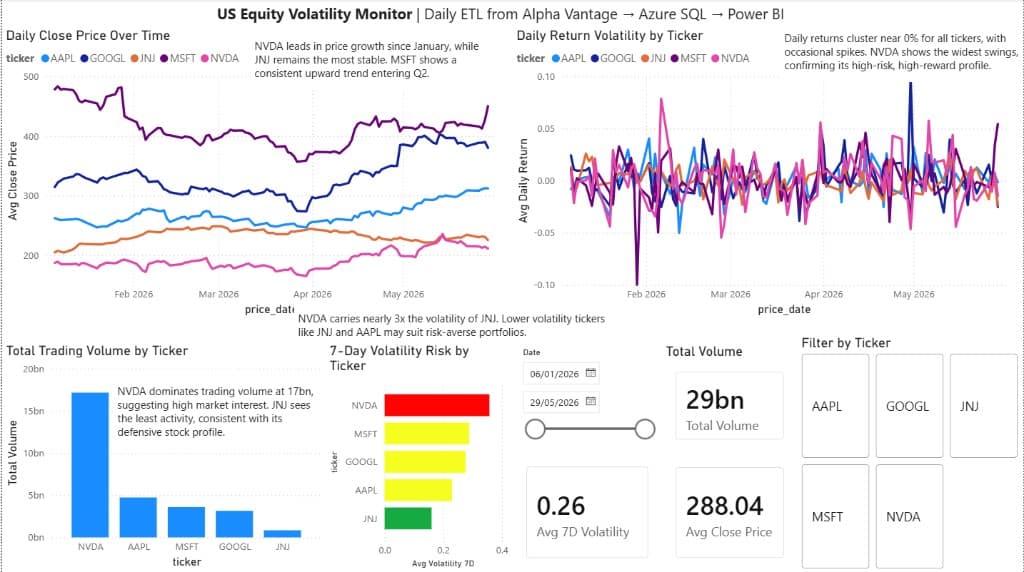
Question
How can we identify customers who are likely to churn and take proactive measures to retain them? What are the most important factors that influence churn?
Outcome
Quantified $139K in at-risk monthly recurring revenue and identified Month-to-Month contracts as the primary churn driver, producing 4 actionable retention recommendations.
Power BIData AnalysisData VisualizationDashboard DesignPandasPython
Presentation project
03
Muscledia project screenshot — Product analytics / diploma project

Product analytics / diploma project

Muscledia

A gamified fitness tracking app where workouts become quests and user progress becomes a measurable retention loop.

Question
How can a fitness app make daily training feel rewarding enough that users return without being pushed?
Outcome
Analyzed engagement and feedback signals tied to a 40% lift in daily adherence, 30% stronger active session participation, and 25% better goal consistency.
React NativeExpoTypeScriptNode.jsMongoDBMySQLAI recommendations
Closed source
04
QGIS Deepness project screenshot — Geospatial analysis / research tooling

Geospatial analysis / research tooling

QGIS Deepness

An open-source QGIS plugin that makes deep-learning-based remote sensing workflows more approachable for QGIS users.

Question
How can researchers use orthophoto imagery to classify land use, detect objects, and test models across terrain types?
Outcome
Contributed mainly through documentation support and testing notes, helping clarify workflows for users rather than driving the core plugin development.
DocumentationQGISRemote sensingDeep learning workflowsUser guidance
Documentation support

Personal telemetry

The analyst, not just the analysis.

A small dashboard of the life behind the work.

Yes, I built a dashboard about myself. No, I'm not sorry.

Egemen Erin / live countersPersonal stats
calculating

Hours alive

Honestly, pretty impressive for a data analyst.

...

Days in Poland

POLSKA GUROM!!!

6

Kaggle challenges

Practice notebooks and competition-style problem solving.

42

Datasets cleaned

A deliberately rounded count for messy CSVs, survey files, and project data.

3

Languages learned

Turkish, English, and Polish.

Skills and credentials

A practical analytics stack with engineering depth.

Analysis

Data wranglingExploratory analysisReportingTrend analysisDashboard design

Languages

PythonSQLJavaScriptTypeScript

Data Stack

PandasNumPyScikit-learnJupyterExcelCognos AnalyticsPower BI

Machine Learning

PyTorchTensorFlowScikit-learnModel evaluation

Engineering

MongoDBMySQLGitGitHub ActionsAzureNode.js